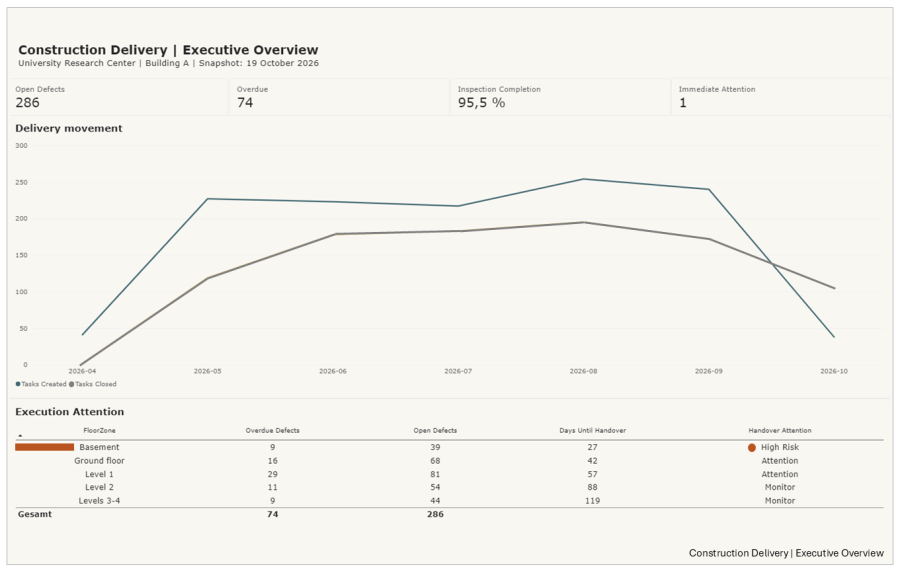
What a Power BI reporting experiment reveals about connecting operational information, management priorities, and project execution.
A project can have hundreds of open tasks, completed inspections, approaching deadlines, and detailed progress reports. Yet management may still struggle to answer a straightforward question: where does delivery need attention today?
The information is usually available. Tasks have owners, inspections have results, and milestones have dates. But each record describes only part of the situation.
An overdue issue may look manageable in isolation. Considered alongside unresolved work, closure rates, and an approaching handover deadline, it may tell a different story.
This is familiar from my experience in digital product, platform, and project delivery. Operational systems record activity, but turning that information into management decisions requires another layer of thinking.
Testing the reporting structure
I wanted to explore this through a practical exercise rather than another conceptual framework. Using synthetic construction project data reflecting common field management workflows, I developed a five-page reporting demonstration in Microsoft Power BI.
I started with the questions a project team might ask. How much work remains unresolved? Is the backlog growing? Where are overdue issues accumulating? How does inspection activity relate to quality performance? And where might unresolved work affect upcoming commitments?
These questions shaped the reporting structure.
I built a relational data model, developed DAX measures, and created five connected views covering quality management, inspections, delivery trends, handover readiness, and executive reporting. I then published the demonstration to Power BI Service for initial review and discussion.
The exercise covered the process from defining reporting requirements to deploying a functional solution.
Moving from activity to management attention
The executive overview brings several dimensions of delivery together: open and overdue defects, inspection completion, monthly task creation and closure, outstanding work by trade, and handover exposure.
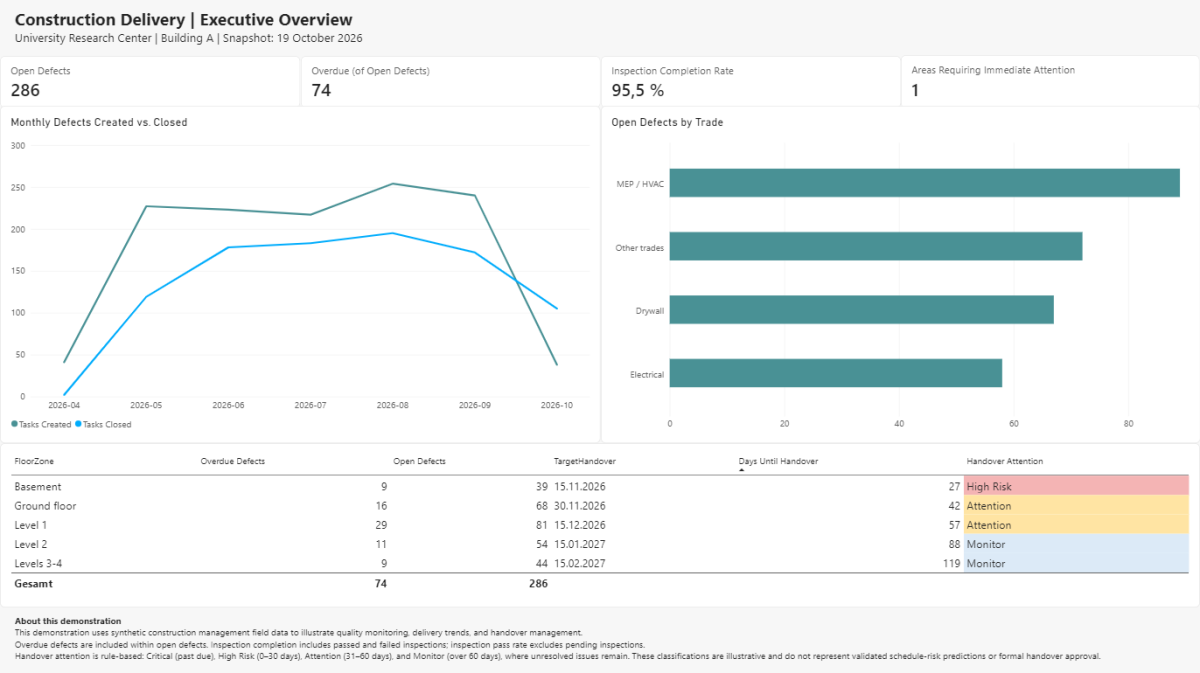
In the synthetic scenario, the report identifies 286 open defects, including 74 overdue items, alongside a 95.5% inspection completion rate. Useful figures, but not conclusions.
I’ve learned repeatedly that high inspection completion doesn’t necessarily mean defects are being resolved quickly enough. Similarly, fewer newly created tasks don’t automatically indicate improving delivery performance. It’s the relationships between indicators that always matter.
The handover view adds context by comparing unresolved work with target dates. Rule-based indicators highlight areas requiring management attention.

In the example, one building area is classified as high risk because of its position within the illustrative reporting rules. That classification is a prompt for management investigation, not an automated assessment of actual project risk.
A delivery manager still needs to understand issue severity, dependencies, available resources, and potential effects on the handover sequence. This is where experience matters, and where reporting and delivery management are critical.
Building the solution was only part of the exercise
The technical work involved data relationships, measures, filtering, and report presentation. For me, the more interesting decisions concerned what the information should communicate.
Should management see total tasks or the unresolved backlog? Should inspection completion be separate from inspection quality? What justifies an escalation indicator? How much detail belongs in an executive overview. These questions require understanding how work is organized, performance is interpreted, and decisions are made. They arise equally in software delivery, platform implementations, and transformation programs where multiple teams contribute to shared commitments.
Construction provided a useful example because quality issues, trade dependencies, and handover deadlines make delivery consequences particularly visible.
What the experiment demonstrates
The result is a functional Power BI demonstration using synthetic data, not a live integration with a field management system. Its attention thresholds are illustrative.
It demonstrates how operational information can be organized into connected reporting views that support investigation and management priorities.
It doesn’t establish faster decisions, quicker issue resolution, or improved project performance. Those outcomes would require testing with actual users and observing how reporting influences decisions and follow-through.
Taking this to the next stage would require: validating whether people can interpret the information, identify the next action, assign responsibility, and verify the outcome.
For me, that’s the larger Digital Project Delivery question.
A dashboard can make the current situation visible. The delivery organization still has to turn that visibility into decisions, ownership, and action.
About the Author
Jeffrey Albert Kalil writes about digital project delivery, digital platforms, and the organizational challenges of delivering complex work. Drawing on experience across SaaS, digital products, and construction, he explores how technology, information, decisions, and cross-functional coordination influence project execution and business outcomes.
About this Series
Digital Delivery Insights explores how organizations turn digital capabilities into effective delivery. Through practical experiments, project observations, and cross-industry perspectives, the series examines the relationship between technology, project organization, decision-making, and execution performance.